tinySafetyNet
No internet and feeling unsafe? Keep this tiny thing in your pocket.
Overview
TinySafetyNET is a real-time distress detection system built around deep-learning audio analysis and IoT alerts. It simulates a smart safety badge that listens to environmental audio, uses a depthwise-separable CNN (DS-CNN) to detect distress emotions such as fear (screaming) or anger (aggression), and, when a threat is detected, triggers a visual and audio alarm on a wearable badge simulated in Wokwi, communicating over WiFi via MQTT.
The model is just 40 KB, small enough to fit on ultra-low-flash IoT devices. That is what TinyML is about for me: efficient, deployable intelligence, applied here to women's safety.
The project grew over several "weeks" into a broader platform: a live inference dashboard, an R analytics dashboard, a Spark-based analytics pipeline with OLAP cubes, and containerised deployment on Kubernetes.
What it does
Live detection and alerts
- Continuously listens through the microphone using a rolling audio buffer.
- Runs a lightweight TensorFlow Lite DS-CNN model on MFCC features.
- Publishes the result over MQTT to the badge, which reacts as follows:
- Fear / scream: flashing red LED and a high-pitch alarm (triple flash and beep)
- Anger / aggression: yellow LED and a warning beep
- Safe: steady green LED
- A Streamlit dashboard shows live confidence scores, inference state and MQTT status.
Analytics dashboard (R Shiny)
- Upload CSV or Excel inference logs (columns:
id,timestamp,inference_of_emotion), map emotions into custom classes, and explore class distribution, timelines, daily trends, hour-wise heatmaps and per-device analysis, with time-based filtering and a dark/light toggle. - Ships with
tess_emotion_log.xlsx, generated from the TESS dataset, plus a synthetically generated log and the scripts that produced both.
Safety prediction and Spark analytics platform (Week 4)
- Predicts the safety level of a location (classes
safe,unsafe,danger) from contextual signals: coordinates, time of day, crowd density, lighting, noise, emotional signals and risk scores. - Synthetic dataset generation, including a 1M+ row generator for big-data experiments; predictions and logs stored in SQLite (
safety_data.db,safety_logs.db). - Apache Spark query modules for dataset partitioning, CSV vs Parquet and SQL vs Spark performance comparison, danger-event counts, emotion analysis, time-of-day risk analysis, risk scoring and summary reports.
- Geographic hotspot detection by running K-Means on the latitude/longitude of danger events and plotting the clusters on a map.
- A streaming simulation (
stream_generator.py) that continuously updates the K-Means model and blinks danger spots on a map restricted to NSUT coordinates, stored inlive.db. - Five OLAP cubes (
risk_score_cube,geographic_cube,emotion_risk_cube,hour_risk_cube,hour_emotion_risk_cube) with query and visualiser scripts, surfaced in a Streamlit analytics dashboard.
MLOps
- Docker images for both the Python inference service and the R Shiny service.
- Kubernetes manifests (Minikube) for both dashboards plus a data-validation CronJob.
- CI/CD through GitHub Actions, with an automated data validation layer (
data_validator.py).
How it's built
Model architecture (DS-CNN). Input MFCC features of shape 40 × T × 1 → convolution (downsampling) → two depthwise-separable convolution blocks → global average pooling → dropout (rate 0.4) → dense layer with softmax → emotion class. Exported to TensorFlow Lite (women_safety_dscnn_f16.tflite) with label mappings in classes.npy.
Audio and inference. Python 3.10+, TensorFlow Lite, Librosa for MFCC extraction, PyAudio; configurable sample rate (22050 Hz, matching training), chunk duration (0.5 s) and MQTT topic.
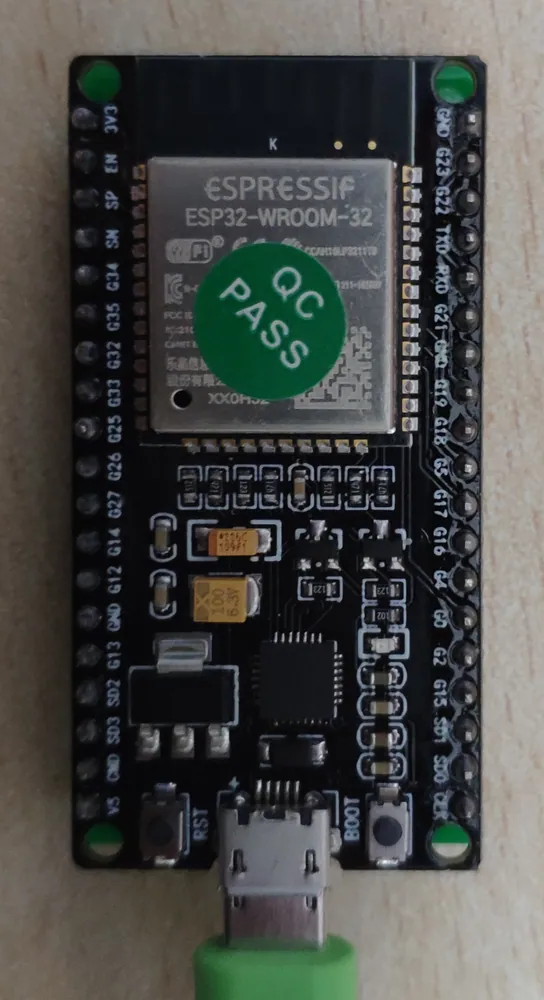
IoT. Paho-MQTT publishing to a HiveMQ broker; the badge is an ESP32 simulated in Wokwi with red, yellow and green LEDs and a buzzer. The firmware (sketch.ino, using WiFi.h and PubSubClient) subscribes to the topic and maps single-character commands S (safe), C (caution) and D (danger) to the LED and buzzer patterns above.
Dashboards and analytics. Streamlit (Python) for live inference; R Shiny (shiny, readxl, dplyr, ggplot2, lubridate, bslib, and others) for historical analytics; Apache Spark with Parquet storage for the large-scale pipeline, requiring OpenJDK 17 and winutils/Hadoop on Windows; SQLite for logging; Conda environments for the Spark module.
Deployment. Docker, Kubernetes via Minikube (streamlit-deployment.yaml, shiny-deployment.yaml, data-ops-cronjob.yaml), and GitHub Actions workflows.
Next project
Zombies-learning-progression-PGGAN