Projects
GUI CANSAT
Tkinter GUI that replays CanSat flight telemetry as live plots.
Repository ↗July 2024
✓ 3 claims checked against the source repository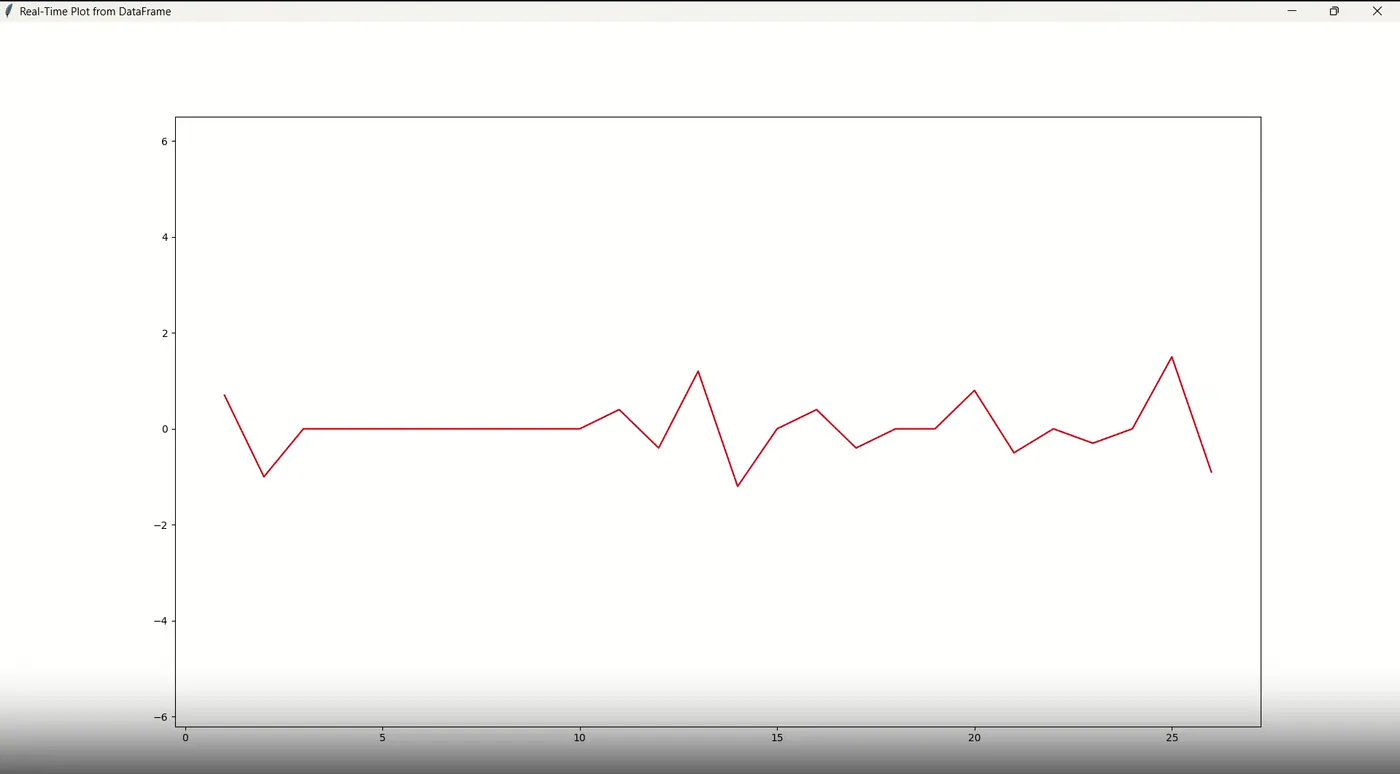
Overview
A desktop ground-station simulator, built while exploring Python's Tkinter module: it reads a recorded CanSat flight telemetry CSV (team ID 2022ASI-049, 412 packets) and animates altitude, pressure, or vertical velocity against time, one sample per second, to imitate a live mission-control display.
What it does
modified_gui.py— the combined app: a dropdown picks velocity, pressure, or altitude; a matplotlib animation redraws the chosen plot one point per second inside the Tkinter window.altitude.py,pressure.py,velocity.py— single-quantity versions of the same window.- Preprocessing shared by all four scripts: timestamps are converted to seconds and shifted to start at zero, and velocity is derived as the finite difference of altitude over time. Only the first 31 telemetry samples are plotted.
output.html— a pandas-profiling report generated over the full CSV.
Status and limitations
Per the README: it replays a recorded file rather than reading live serial or radio input, and pressure.py/velocity.py/modified_gui.py subtract a hard-coded 69 seconds instead of the file's own minimum timestamp. No tests.
Next project
Alien Invasion (Pygame)