BrainwavesFinland — finding a tumour with microwaves
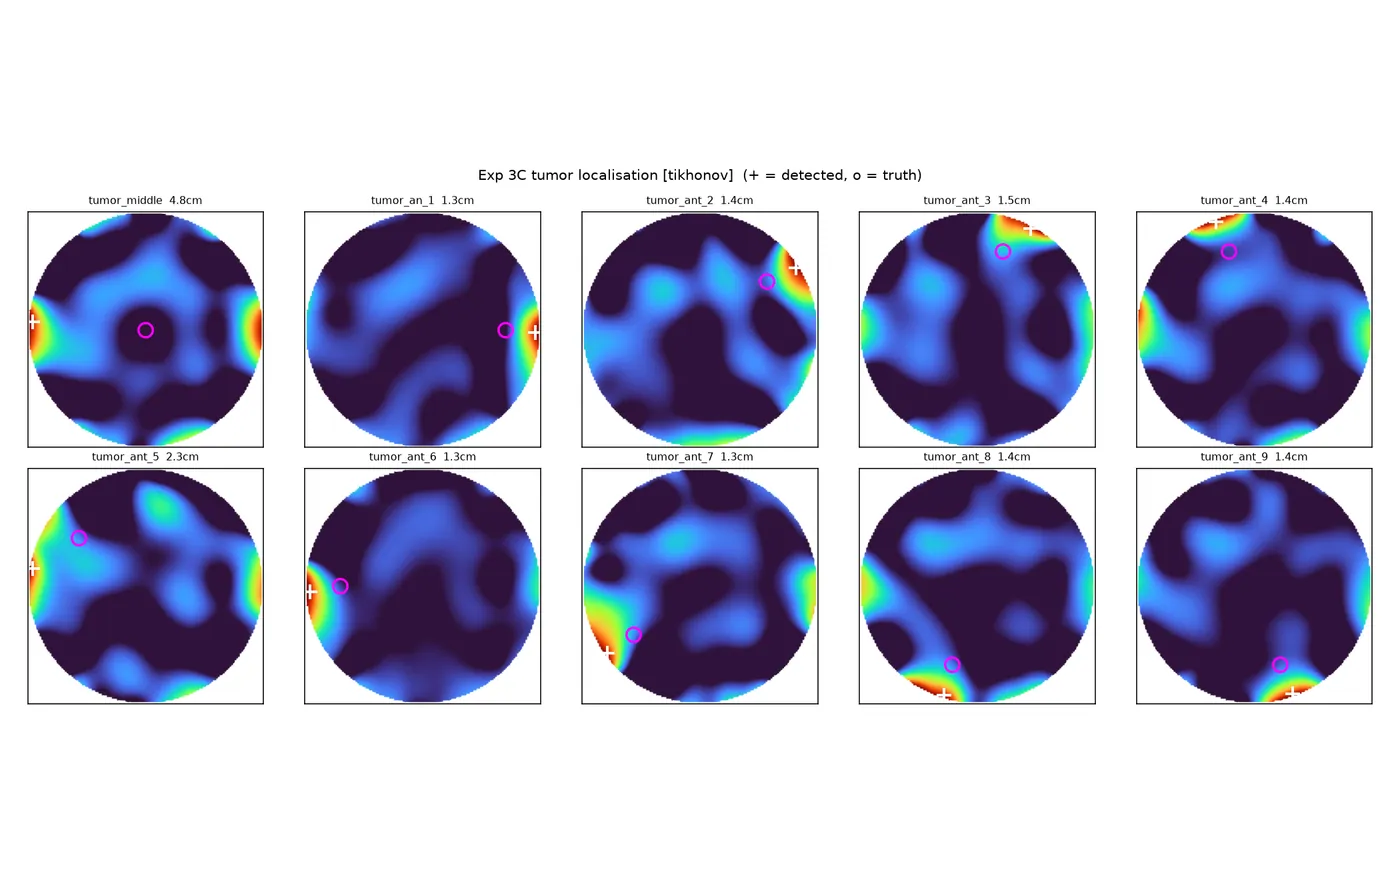
Microwave tomography: locating a 30 mm tumour inside a brain phantom from antenna measurements alone. Reconstructed to 1.4 cm median error and 2° angular error across ten positions.
Overview
MRI and CT are how brain tumours are found today. Both are expensive, slow to schedule, and tied to a hospital. Microwave tomography is a long-standing alternative idea: surround the head with small antennas, send harmless low-power microwaves through it, and reconstruct what's inside from how the signals change — a tumour has different electrical properties from healthy tissue, so it should leave a fingerprint. The hardware is cheap and portable; the hard part is the maths of turning a handful of noisy signals back into an image.
This project works on measurement data from a brain-phantom experiment carried out in Finland: a 10 cm liquid "brain" in a beaker, a 30 mm tumour placed at different positions, and a ring of antennas driven by a vector network analyser through an Arduino-controlled switching matrix. The goal: recover the beaker outline and light up the tumour as a bright dot, from the antenna data alone.
The data
Three experiments were recorded. The one that matters is the two-port set: 36 transmitter–receiver pairs (a 6 × 6 switch matrix), each measured across 801 frequencies from 1.5 to 6.5 GHz, for a tumour-free baseline and ten tumour positions — nine around the ring and one in the centre.
A first, unglamorous contribution was pinning down the data format itself. Older notes described the single-port files as real/imaginary pairs; they are magnitude-in-dB and phase. Getting that wrong makes every downstream result meaningless, so the loaders now verify the format numerically.
What we did
An earlier attempt at reconstruction had placed the tumour essentially at random (≥ 5 cm off). Rather than add more machinery, we diagnosed why — and each cause turned out to be a physics or data problem, not a modelling one:
- The array geometry was wrong. The switch-to-antenna wiring wasn't documented, and the assumed layout was physically impossible (signal increased with distance). We recovered the true geometry from the tumour-free data, using the fact that transmission through a lossy medium must fall with distance.
- The earlier images were of instrument drift, not the tumour. Scan-to-scan drift accounted for roughly 90 % of the measured change; the tumour is the remaining 10 %. We separate the two before imaging.
- Phase was unreliable across cable positions, so the imaging works in the magnitude domain.
With those fixed, two imagers run on the cleaned data: a robust back-projection that works for every case including the centre, and a higher-resolution inversion that is sharper off-centre. Every step was validated first on synthetic data with a known answer (recovered to under 0.1 cm) before touching real measurements.
Results
Across the ten tumour positions:
| median distance error | angular error | correct sector | |
|---|---|---|---|
| Higher-resolution inversion (9 off-centre cases) | 1.4 cm | 2° | 100 % (≤ 36°), 89 % (≤ 18°) |
| Robust back-projection (all 10, incl. centre) | 1.9 cm | — | 78 %; centre case 1.3 cm |
The angular accuracy — about 2° on a 55 mm ring — is close to the physical limit of the setup. The radial estimate has a known bias toward the boundary, and the centre position is a blind spot for the sharper method (transmission between opposite antennas is least sensitive there); the robust imager covers it. Both limitations, and the assumptions behind the ground-truth positions, are written down with the results rather than smoothed over.
Status
Active research with a private repository, so the full reconstruction pipeline isn't published here. The banner shows the reconstructed images for the ten tumour positions — the bright spot is the recovered tumour, the ring is the beaker wall. Next steps are a fuller antenna ring to remove the central blind spot, adding reflection channels, and a write-up.
Next project
PyAMorph (formerly pySdf)